How to set global font in Matplotlib: for non-root users
Published on January 31, 2025
TL, DR:
- Step 1: Create a local share font folder:
mkdir -p ~/.local/share/fonts - Step 2: Copy the font’s .ttf file into the directory
- Step 3: Clear Matplotlib’s font cache:
rm ~/.cache/matplotlib/fontlist-*.jsonor
rm -r ~/.cache/matplotlib/ - Step 4: Verify the font installation:
import matplotlib.font_manager as fm # List all available fonts available_fonts = [f.name for f in fm.fontManager.ttflist] print("Arial" in available_fonts) # Check if Arial is available - Step 5: Update font parameters
plt.rcParams['font.family'] = 'Arial' # Change to your font name
Motivation
The default font for Matplotlib figures is DejaVu Sans. In academic papers, however, Sans-serif fonts like Arial, Helvetica and serif fonts like Times New Roman are more widely accepted. Unfortunately, none of the three fonts is installed on the cluster I’m currently using.
Normally when we want to set a global font in Matplotlib that doesnt exist on the computer, we can download its .ttf file, double-click it to install(mac) or put it under ~/.fonts or /usr/share/fonts(linux), then update Matplotlib’s font cache so it recognizes the new font. However, it is impossible to edit the /usr/share/ folder or use sudo apt install to install powerful packages like msttcorefonts as a non-root user. This guide shares a workaround for non-root users who want to:
- Use custom fonts in Matplotlib.
- Avoid manually styling every plot element.
- (Bonus) Pretend their plots were made in MATLAB. 😉
Manual Font Styling: The Element-by-Element Approach
The first way I tried was to download the .ttf file and put it in a local folder, then use FontProperties from matplotlib.font_manager to manually assign fonts:
from matplotlib.font_manager import FontProperties

arial_font_path = "../data/fonts/arial.ttf"
arial_font = FontProperties(fname=arial_font_path)  # define font property
Then, I applied it to specific elements:
np.random.seed(0)
plt.hist(np.random.randn(1000), bins=30, edgecolor='black', color='skyblue', label="Random Data")
plt.text(0.5, 80, "Hello, Matplotlib!", fontsize=20, fontproperties=arial_font)
plt.savefig("./fontprop.png", dpi=300, bbox_inches='tight')
plt.show()
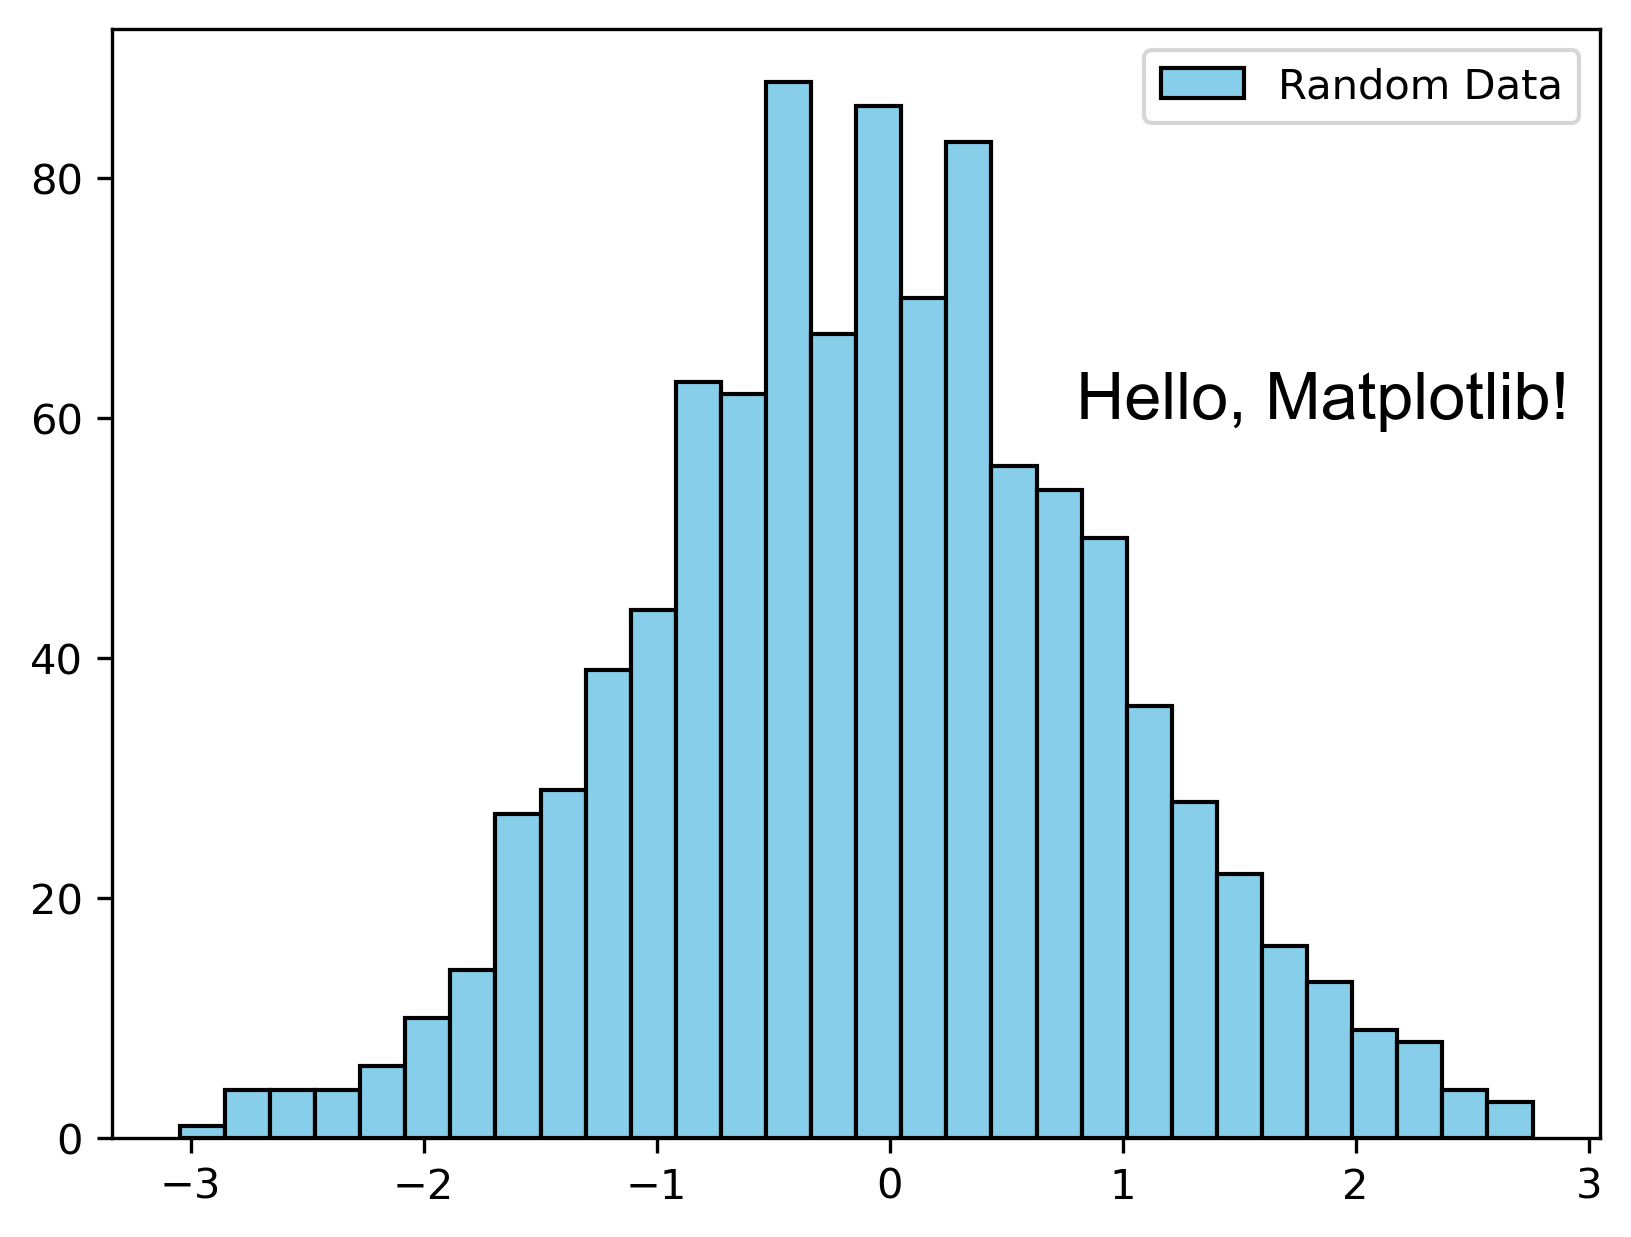
As we can see, the text ‘Hello, Matplotlib!’ in the figure is Arial now, off to a great start! However, the axis ticks and the legend are still in default fonts. We need to add the font property to their corresponding function too to make them Arial:
np.random.seed(0)
plt.hist(np.random.randn(1000), bins=30, edgecolor='black', color='skyblue', label="Random Data")
plt.text(0.5, 80, "Hello, Matplotlib!", fontsize=20, fontproperties=arial_font)

# Set x,y ticks and legend fonts to Arial
for label in plt.gca().get_xticklabels():
    label.set_fontproperties(arial_font)
for label in plt.gca().get_yticklabels():
    label.set_fontproperties(arial_font)
plt.legend(prop=arial_font)

plt.savefig("./fontprop.png", dpi=300, bbox_inches='tight')
plt.show()

Setting all the elements to a new font took us 4 new lines and 207 new characters, what a feast for bookworms that live by codes! As we can imagine, the more elements we put in the figure, the more tedious it becomes. Although this method is flexible and can set different styles for different elements in the figure, it’s better to find a way to default the font to what we want, especially for someone lazy and someone whose jupyter notebook constantly remembers and forgets variables.
Global Font Mastery: The Non-Root User’s Workaround
In analogy to installing .ttf in /usr/share/fonts, we can install it in our own local share folder, ~/.local/share/fonts (the parallel between usr and local folders is also true in many other scenarios). First, create a local share folder by running this command in the terminal:
mkdir -p ~/.local/share/fonts
Then copy your font files (.ttf, .otf, etc.) into this directory. The next step would be clearing Matplotlib’s font cache. Run in terminal:
rm ~/.cache/matplotlib/fontlist-*.json
or
rm -r ~/.cache/matplotlib/
*Note: some tutorials mentioned using the fm._rebuild() function in matplotlib.font_manager, but this did not work for me probably because of version issues.
Now, time to verify if magic appears! Run in a script or jupyter notebook:
import matplotlib.font_manager as fm

# List all available fonts
available_fonts = [f.name for f in fm.fontManager.ttflist]
print("Arial" in available_fonts)  # Check if Arial is available
If Arial is in the list, the font is successfully recognized, congrats (and please put a heart to this blog)! All that’s left to do is to update the parameters to your favorite font. If you are unsure of the name of the font (e.g.arial or Arial), you can print the names of available fonts by running print(available_fonts) in the last step.
plt.rcParams['font.family'] = 'Arial' # Change to your font name
Now the fonts in your matplotlib plots are defaulted to Arial or anything you prefer, finally getting rid of the ugly, so matplotlib-ish DejaVu Sans (sorry DejaVu Sans and matplotlib fans)! Let’s try out the new OOTD:
import matplotlib.pyplot as plt

plt.rcParams['font.family'] = 'Arial'  # Use your installed custom font

np.random.seed(0)
plt.hist(np.random.randn(1000), bins=30, edgecolor='black', color='skyblue', label="Random Data")
plt.text(0.8, 60, "Hello, Matplotlib!", fontsize=16)
plt.legend()
plt.savefig("./fontglob_all.png", dpi=300, bbox_inches='tight')
plt.show()

Mission completed! This time there’s only 1 new line and 37 new characters. Good non-root users save memories for the server.
Troubleshooting Tips
- If fonts aren’t detected, try restarting your Python kernel.
- Use
print(fm.fontManager.ttflist)to debug font names. - Ensure your .ttf files aren’t corrupted (you can find the .ttf file for most common fonts on Github).
Hope this is helpful, thanks for reading!
References:
- https://scentellegher.github.io/visualization/2018/05/02/custom-fonts-matplotlib.html
- https://stackoverflow.com/questions/42097053/matplotlib-cannot-find-basic-fonts
- https://stackoverflow.com/questions/40290004/how-can-i-configure-matplotlib-to-be-able-to-read-fonts-from-a-local-path